← All work
Data analysis · Nov 2025
Customer Shopping Behavior
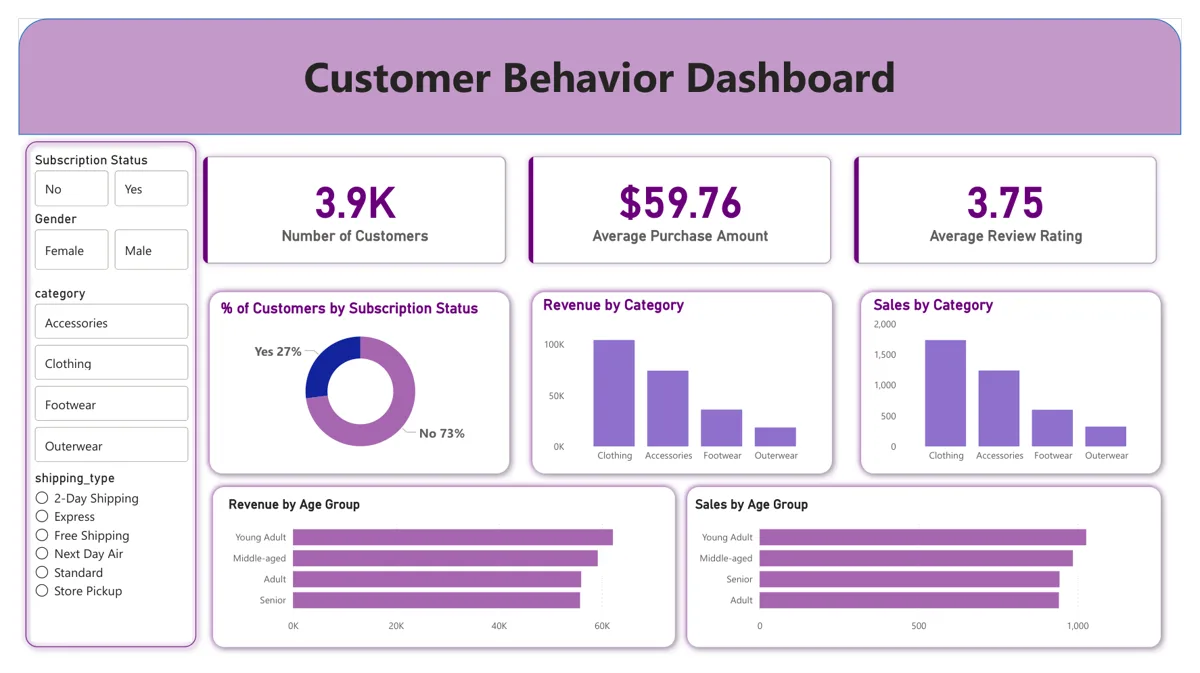
3,900 retail transactions cleaned in pandas, 10 business questions answered in SQL, and a Power BI dashboard.
- Data
- 3,900 retail transactions
- Tools
- pandas, PostgreSQL, Power BI
- Python
- PostgreSQL
- Power BI
What I did
- Cleaned the data in pandas: filled missing review ratings with the median for each product category, and engineered age-group and purchase-frequency features.
- Loaded the cleaned table into PostgreSQL.
- Answered 10 business questions in SQL: revenue by segment, how much each group depends on discounts, top products per category, and subscriber versus non-subscriber spend.
- Built a Power BI dashboard with filters for subscription, gender, category and shipping type.
Recommendation
Stronger subscription incentives and a tighter discount strategy. Only 27% of customers subscribe, and revenue is concentrated in a few categories and age groups, so discounts should target the segments and products that actually drive revenue.